System Performance Report
One of the key problems that Administrators were facing when it came to performance data in Extended ECM was that they often had to be proactive. Either enabling your summary timings logs and maintaining them, or for more granular performance data be running with Threads and Connects enabled in order to capture things like callback execution time.
This presented problems especially around upgrades, and performance before and after. I recall many years ago working in support and talking to customers who would say performance got worse for a specific function after an upgrade. We'd get logs but without the historical data it would be hard to know precisely what performance they were seeing prior to compare it to the current. Was there a real problem, or a perceived problem?
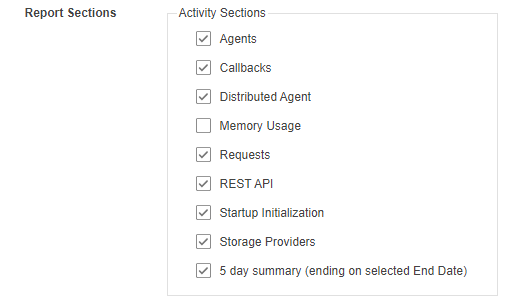
With that in mind, we've added in the System Performance Report into Extended ECM. It's now been deployed in the product for a while now. So this is far from a "new" feature. However I figured I'd do a small post on some of its key features. First and foremost the SPR is _always_ collecting data. It leverages a ring table in the database that is capped at a million rows. We capture data around Agents, Callbacks, Distributed Agent, End User requests, REST API, system startup, and storage providers. Additionally, you can enable memory usage data to be tracked in the SPR however this is off by default.
This allows Administrators to see an hourly breakdown of the performance of almost all of the operations in their system, allowing them to identify trends, and isolate if changes to the infrastructure, or the Extended ECM system have had a positive or negative impact on performance. I want to be clear that the SPR isn't a magic bullet that removes the need for Thread and Connect logs. It simply works to help narrow the focus of your investigation to any possible performance issue to speed up the resolution.
Running a report
To run a report, Administrators can navigate to the Content Server Administration pages and locate the page “System Performance Report”. Once you enter the page at the top you will see information outlining how much performance data can be reported on.

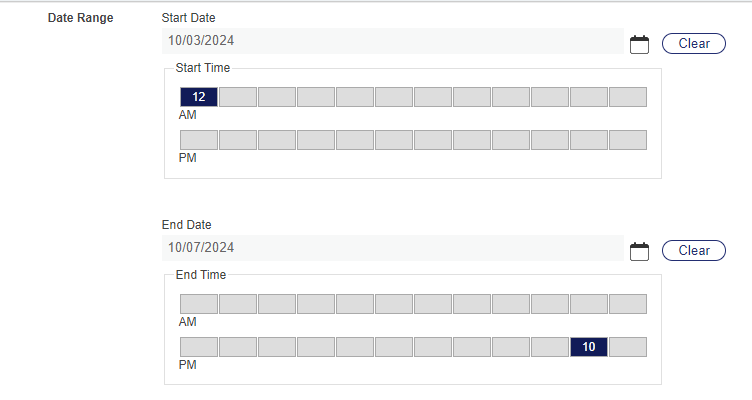
Next under Options we can select which time window we want to generate a report for. This allows us to isolate the report to when performance issues were identified, or to capture different reports pre and post upgrade.

The next section allows us to pick which aspects of the System Performance Report we want to output. By default, all options are selected. However, if you are only interested in one aspect you can deselect the others to generate a smaller report.

You can download an example of an SPR report here from one of my test systems.
Back to post listing